Compare multiple historian tags, select time windows and sampling intervals, configure axes, grids, series visibility, and aggregation.
OTDataMule Portal
Turn industrial history into operational visibility.
OTDataMule Portal gives engineers, operators, and authorized business users a practical way to explore historian data. Build dashboards, compare trends, organize tags into a plant model, record operational context, and share the views people need.
Historian-nativeExplore raw and aggregated time-series data.
Dashboard builderCompose operational views from reusable widgets.
Plant ModelOrganize tags by site, area, line, and equipment.
Operational contextAdd annotations, events, status, and shared meaning.
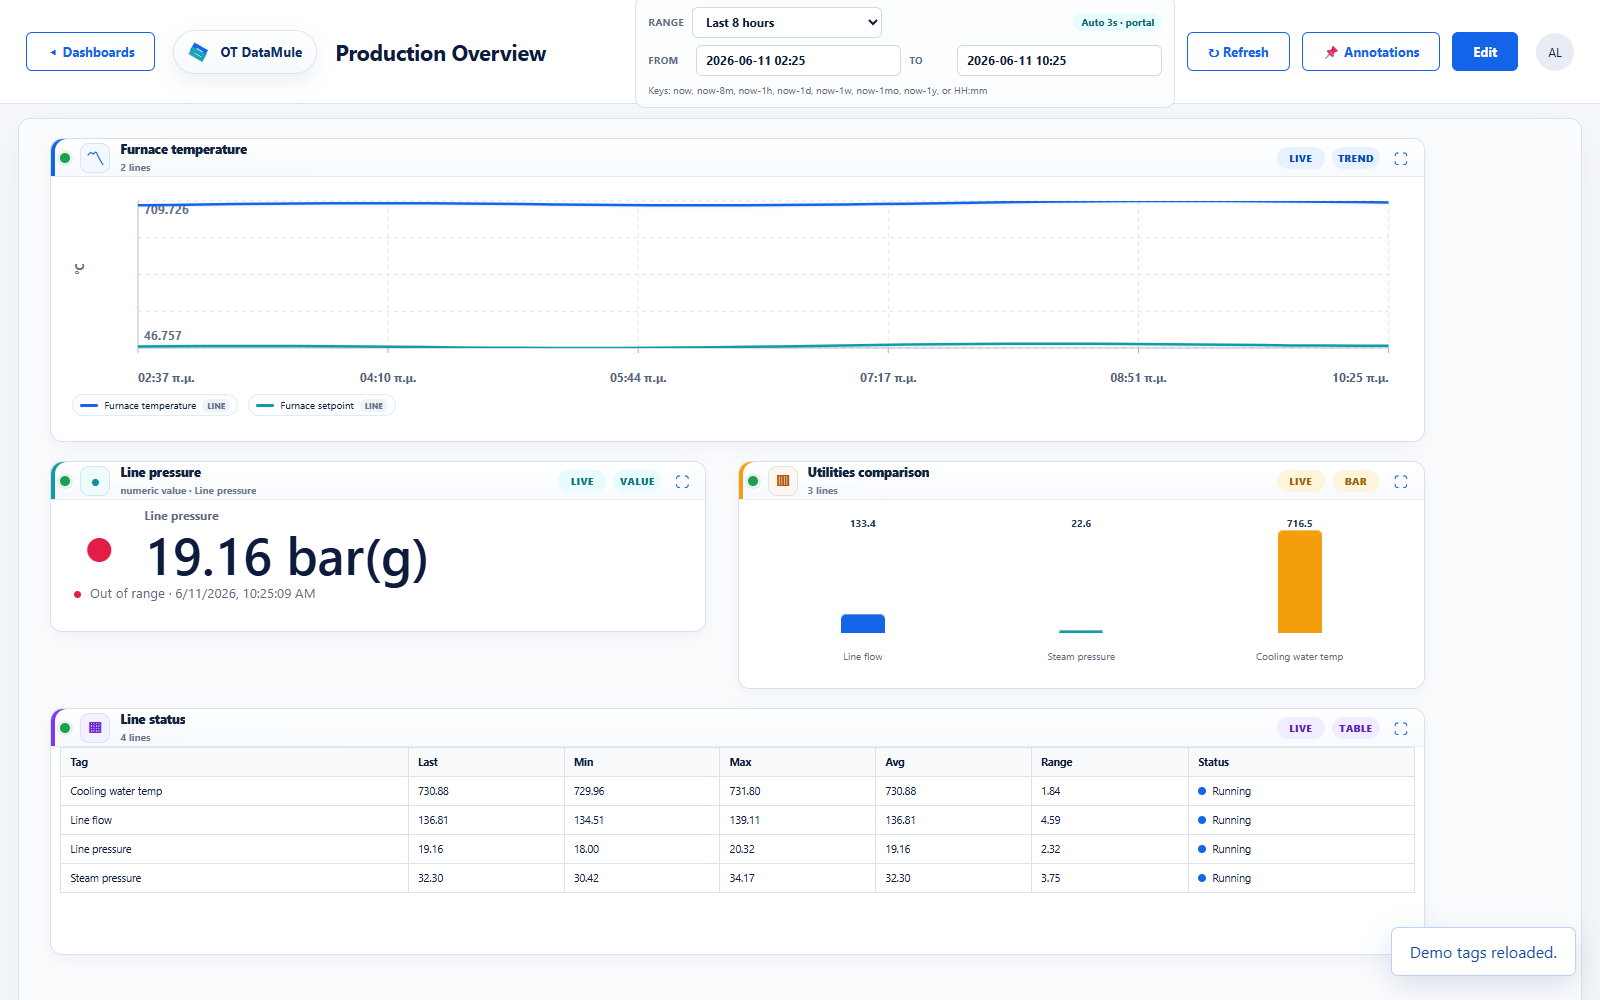
Build the view around the operation.
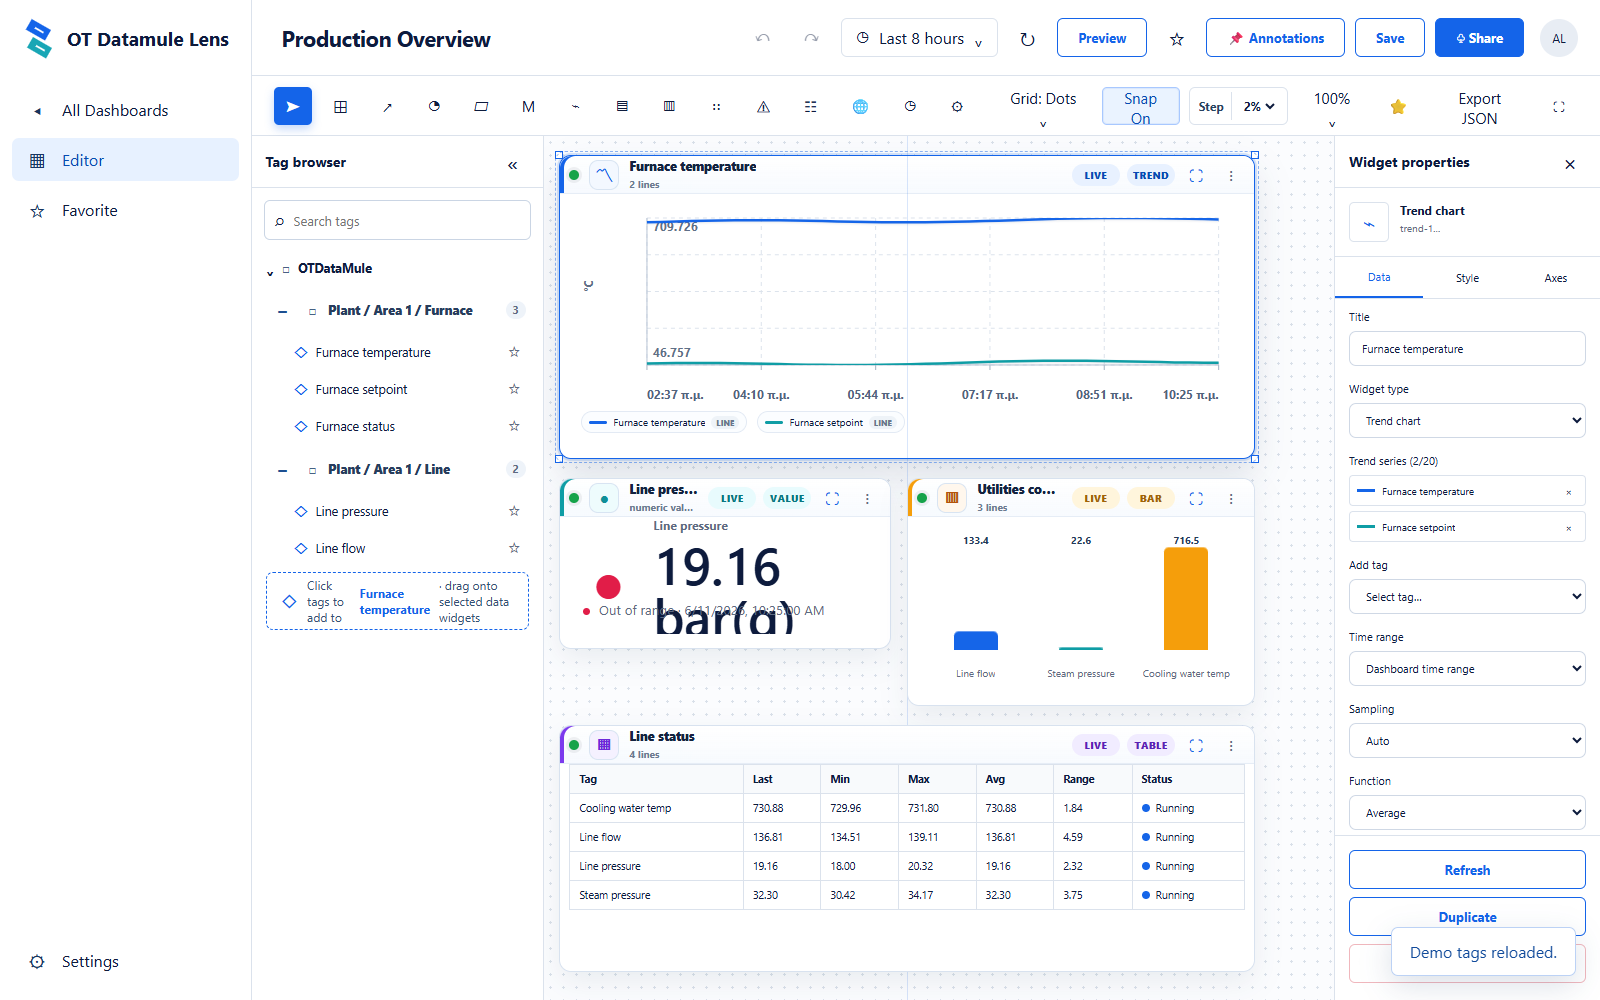
The Portal dashboard editor combines historian tags with configurable widgets, time controls, layout tools, and per-widget properties. Create focused views for a line, utility system, process area, investigation, or management overview.
Use current values, KPI cards, gauges, tanks, tables, bars, scatter plots, alarms, events, clocks, text, equipment icons, and embedded content.
Design the dashboard with drag, resize, alignment, snap, and properties tools, then switch to a clean operational view with automatic refresh.
Navigate production data as a plant, not a tag list.
The Plant Model creates a functional hierarchy over historian tags. Organize the site into areas, lines, equipment, and assets; assign aliases and roles; then use branches to create dashboards and widgets faster.
Manufacturing SitePlant
Area 1Process area
UtilitiesSupport systems
FurnaceTemperature, setpoint, status
Production LinePressure, flow, state
SteamPressure and consumption
CoolingTemperature and flow
01Structure assets
Create user-defined nodes that reflect how the facility is understood by operations.
02Attach historian tags
Map raw source tags to equipment and give them useful display aliases and roles.
03Generate operational views
Use selected branches to create trend, table, KPI, and equipment-focused dashboards.
Preserve the context around the numbers.
Historian values explain what changed. Portal collaboration and analysis features help teams record why it changed, who needs to see it, and what should happen next.
Annotations
Mark operational events on history.
Add information, warning, alarm, and maintenance annotations to a global timeline, a specific tag or alias, or an asset node. Record notes such as maintenance starts, batch changes, trips, and investigations.
Sharing
Give each user the right view.
Create personal dashboards, mark favorites, and share dashboards with viewer or editor permissions. Administrative tools manage users, ownership, sharing, and portal settings.
Exports
Take historian data into the next workflow.
Select tags, time ranges, and sampling intervals, then export history for offline analysis, reporting, evidence, and collaboration with other teams.
Analytics
Move from trends toward decisions.
Explore statistics, data quality, trend direction, rates of change, limits, and forecasting tools using selected historian tags and Plant Model aliases.
Designed around the OTDataMule Historian
Fast views over raw and aggregated time-series data.
The Portal reads OTDataMule historian data through controlled application services. Raw measurements support detailed investigation, while pre-aggregated intervals make longer trends practical and responsive.
RawDetailed measurements
10 secShort operational windows
1 minShift and daily trends
1 hour / 1 dayLong-term performance
Use the Portal where shared visibility creates value.
Start with a small group and a focused operational question. Expand the plant model, dashboards, users, and history coverage as teams adopt the platform.
Production monitoring
Give supervisors and engineers a common view of process values, states, limits, and recent behavior.
Energy and utilities
Track steam, cooling, electricity, pressure, flow, and other site utilities across areas and time.
Investigations
Compare tags around an event, add annotations, inspect history, and export the relevant evidence.
Cross-team reporting
Share curated dashboards with operations, maintenance, quality, management, and authorized enterprise users.
Plan an OTDataMule Portal POC.
Choose a production area, a representative group of historian tags, two or three dashboards, and the users who need access. We will help define the plant model, views, history window, and success criteria.
Email: info@diodos-tech.com
Company: DataDiode IKE, Athens, Greece